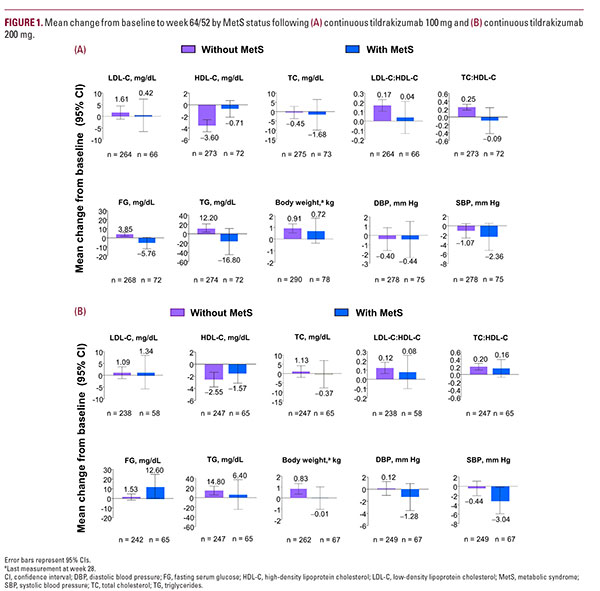
Mean changes in cardiometabolic risk factors LDL-C, TC, body weight, and DBP were similar in patients with and without MetS receiving tildrakizumab 100 mg (Figure 1A). Both FG and TG were numerically decreased relative to baseline in patients with MetS but not in patients without MetS; patients with MetS had numerically larger decreases in SBP from baseline relative to patients without MetS at week 64/52 (Figure 1A). Mean percent changes from baseline (95% CI) at week 64/52 for patients with MetS relative to patients without MetS were –1.4 (–6.0, 3.2) vs 4.7 (2.6, 6.8) for FG, 4.4 (–5.0, 13.8) vs 16.6 (10.6, 22.6) for TG, and –1.5 (–3.6, 0.6) vs –0.3 (–1.5, 0.9), for SBP.
Patients with MetS receiving 200 mg tildrakizumab had similar mean changes from baseline in LDL-C, HDL-C, TC, TG, and body weight relative to patients without MetS (Figure 1B). Patients with MetS had numerically larger mean decreases in SBP and DBP and a numerically larger mean increase in FG from baseline relative to patients without MetS at week 64/52 (Figure 1B).
Patients with MetS receiving 200 mg tildrakizumab had similar mean changes from baseline in LDL-C, HDL-C, TC, TG, and body weight relative to patients without MetS (Figure 1B). Patients with MetS had numerically larger mean decreases in SBP and DBP and a numerically larger mean increase in FG from baseline relative to patients without MetS at week 64/52 (Figure 1B).