
elbow joints. The MRI images for both treatment areas were acquired in the axial plane using the T1 fast spin-echo sequence with a slice thickness of 3 mm, matrix size 320x320, FOV 26, TR 200 ms. For each calf scan, the leg was bolstered under the ankle and the knee to avoid the suppression of the muscle. Similarly, for the arm scans, each arm was bolstered under the elbow.
To best analyze the changes in arm and calf muscle tissue, the biceps brachii m., triceps brachii m. and gastrocnemius m. were segmented in the MRI images. For each muscle, the slice with the largest cross-sectional area (CSA) was identified and was used for analysis along with two slices approximately 0.5 cm and 1 cm above and below this point (N=5 measurements). CSA for each of the slices and for each muscle was obtained and the average values were calculated. Segmented muscles can be seen in Figure 2.
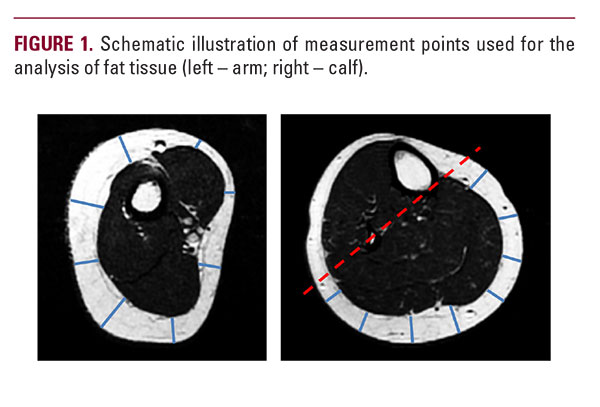
To assess the changes in fat tissue, the fat thickness was measured in the same images which were used for muscle tissue analysis. For arms, the measurements were done at eight points equally sampled all around the arm circumference. For calves, the measurements were done only above the gastrocnemius m. at eight equally spaced points. Then, the average values were calculated. The points for fat measurements are displayed in Figure 1.

RESULTS
A single male and a female subject were recruited for the study
to examine the HIFEM effects on different body compositions.
Interestingly, it should be noted that the male subject had more
than three times the muscle mass in comparison to the female
subject. Both patients showed an increase in all three examined
muscles; biceps brachii m., triceps brachii m., gastrocnemius m.