Susanne Grether-Beck PhD,a Jean Krutmann MD,a Katherine Wilkens MPAP,b and Kasey D’Amato MPAPb
aIUF – Leibniz Research Institute for Environmental Medicine, Düsseldorf, Germany bAirelle Skincare, LLC, Los Angeles, CA
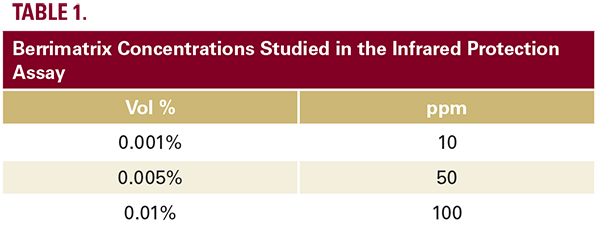
Infinite 200, Tecan, Crailsheim, Germany) at 540 nm. Viability was calculated as percentage of control cells. Those cells were only exposed to cell culture medium and set to 100%.4In-vitro IrradiationPrimary human dermal fibroblasts were exposed to a dose of 360 J/cm2 infrared A radiation which previously was found to be optimal to induce gene expression without affecting viability in this cell type.1 In brief, medium was replaced by PBS, lids were removed, and cells were exposed to infrared A radiation using a Hydrosun 500H IRA device (Hydrosun Medizintechnik GmbH, Mu?llheim, Germany). The IRA device was water-filtered and equipped with a black filter and emits wavelengths between 760 and 1400nm leading to an irradiance of 360 mW/cm2 at a distance of 20 cm measured through a Hydrosun HBM1 irradiance measuring device (Hydrosun Medizintechnik GmbH, Mu?llheim, Germany). The culture dishes were placed on a cooled plate connected to a thermostated bath (Thermo Haake GmbH, Karlsruhe, Germany) to maintain temperatures below 37°C during irradiation. Control cells were held on a 37°C thermostated plate under similar conditions without irradiation.Application of Antioxidant MatrixCells were starved for 24 hours prior to irradiation (0% FCS) and the antioxidant matrix was added into the culture medium for 24 hours. Before starvation, before irradiation and before harvest, cells were washed once in PBS. During irradiation, the antioxidant matrix was not present (PBS incubation). After irradiation, the antioxidant matrix was added again by using a pipette to fresh media containing 2% FCS and was present until harvest of cells 24 hours post IRA treatment. The following 3 concentrations (Table 1) of the antioxidant matrix have been assessed based on the observations made during MTT assay (see Figure 1).RNA Isolation and PCRTotal RNA was performed as described above.2 For isolation of total RNA, we used RNeasy Total RNA Kits (Qiagen, Hilden; Germany). The RNA concentration was determined via photometric measurement at 260/280 (Biophotometer, Eppendorf, Hamburg, Germany). Aliquots of total RNA (100 ng) were applied for cDNA-Synthesis using SuperscriptIII First-Strand synthesis system for the reverse transcription step with random healersD’Amato(Invitrogen, Karlsruhe, Germany). A specific primer pair was designed for each gene by Primer Express 2.0 software (Applied Bio systems, Darmstadt, Germany) based on the cDNA sequence published as indicated (Table 2).Automated pipetting was performed by means of an epMotion 5070 system (Eppendorf, Wesseling-Berzdorf, Germany). The PCR reactions were carried out on a CFX384 Touch Real-Time PCR Detection System (Bio-Rad, Munich, Germany) using Absolute QPCR SYBR Green Mix (Thermo Fisher Scientific, St. Leon-Rot, Germany). Three samples for each condition were processed with 2 determinations, each employing the universal protocol over 46 cycles, and the mean value of these was calculated. In detail, 15 minutes 94° C activation of hot start Taq Polymerase, 20 seconds 95° C denaturation, 20 seconds 55° C annealing, and 20 seconds 72° C extension. For comparison of relative expression in real time, PCR expression observed in untreated samples was arbitrarily set equal to 1 and the corresponding changes were calculated based on the 2 (-ΔΔC(T)) method.3StatisticsThe one-way analysis of variance on ranks SNK was used as a non-parametric test for comparison of differences between measurements and P values of less than 0.05 were considered significant in case of viability testing. ANOVA SNK was performed, if data passed normality and equal variance check, and P values of less than 0.01 were considered statistically significant (SigmaPlot 12.5).
Our website uses cookies to enhance your experience. By continuing to use our site, or clicking "Continue," you are agreeing to our cookie policy | Continue
Privacy & Cookies Policy
Privacy Overview
This website uses cookies to improve your experience while you navigate through the website. Out of these cookies, the cookies that are categorized as necessary are stored on your browser as they are essential for the working of basic functionalities of the website. We also use third-party cookies that help us analyze and understand how you use this website. These cookies will be stored in your browser only with your consent. You also have the option to opt-out of these cookies. But opting out of some of these cookies may have an effect on your browsing experience.
Necessary cookies are absolutely essential for the website to function properly. This category only includes cookies that ensures basic functionalities and security features of the website. These cookies do not store any personal information.
Any cookies that may not be particularly necessary for the website to function and is used specifically to collect user personal data via analytics, ads, other embedded contents are termed as non-necessary cookies. It is mandatory to procure user consent prior to running these cookies on your website.
 Infinite 200, Tecan, Crailsheim, Germany) at 540 nm. Viability was calculated as percentage of control cells. Those cells were only exposed to cell culture medium and set to 100%.4In-vitro IrradiationPrimary human dermal fibroblasts were exposed to a dose of 360 J/cm2 infrared A radiation which previously was found to be optimal to induce gene expression without affecting viability in this cell type.1 In brief, medium was replaced by PBS, lids were removed, and cells were exposed to infrared A radiation using a Hydrosun 500H IRA device (Hydrosun Medizintechnik GmbH, Mu?llheim, Germany). The IRA device was water-filtered and equipped with a black filter and emits wavelengths between 760 and 1400nm leading to an irradiance of 360 mW/cm2 at a distance of 20 cm measured through a Hydrosun HBM1 irradiance measuring device (Hydrosun Medizintechnik GmbH, Mu?llheim, Germany). The culture dishes were placed on a cooled plate connected to a thermostated bath (Thermo Haake GmbH, Karlsruhe, Germany) to maintain temperatures below 37°C during irradiation. Control cells were held on a 37°C thermostated plate under similar conditions without irradiation.Application of Antioxidant MatrixCells were starved for 24 hours prior to irradiation (0% FCS) and the antioxidant matrix was added into the culture medium for 24 hours. Before starvation, before irradiation and before harvest, cells were washed once in PBS. During irradiation, the antioxidant matrix was not present (PBS incubation). After irradiation, the antioxidant matrix was added again by using a pipette to fresh media containing 2% FCS and was present until harvest of cells 24 hours post IRA treatment. The following 3 concentrations (Table 1) of the antioxidant matrix have been assessed based on the observations made during MTT assay (see Figure 1).RNA Isolation and PCRTotal RNA was performed as described above.2 For isolation of total RNA, we used RNeasy Total RNA Kits (Qiagen, Hilden; Germany). The RNA concentration was determined via photometric measurement at 260/280 (Biophotometer, Eppendorf, Hamburg, Germany). Aliquots of total RNA (100 ng) were applied for cDNA-Synthesis using SuperscriptIII First-Strand synthesis system for the reverse transcription step with random healers
 D’Amato(Invitrogen, Karlsruhe, Germany). A specific primer pair was designed for each gene by Primer Express 2.0 software (Applied Bio systems, Darmstadt, Germany) based on the cDNA sequence published as indicated (Table 2).Automated pipetting was performed by means of an epMotion 5070 system (Eppendorf, Wesseling-Berzdorf, Germany). The PCR reactions were carried out on a CFX384 Touch Real-Time PCR Detection System (Bio-Rad, Munich, Germany) using Absolute QPCR SYBR Green Mix (Thermo Fisher Scientific, St. Leon-Rot, Germany). Three samples for each condition were processed with 2 determinations, each employing the universal protocol over 46 cycles, and the mean value of these was calculated. In detail, 15 minutes 94° C activation of hot start Taq Polymerase, 20 seconds 95° C denaturation, 20 seconds 55° C annealing, and 20 seconds 72° C extension. For comparison of relative expression in real time, PCR expression observed in untreated samples was arbitrarily set equal to 1 and the corresponding changes were calculated based on the 2 (-ΔΔC(T)) method.3StatisticsThe one-way analysis of variance on ranks SNK was used as a non-parametric test for comparison of differences between measurements and P values of less than 0.05 were considered significant in case of viability testing. ANOVA SNK was performed, if data passed normality and equal variance check, and P values of less than 0.01 were considered statistically significant (SigmaPlot 12.5).