proportional hazard regression model was applied with factors dose group, study site, and baseline investigator-assessed FWS score at maximum frown. For safety endpoints, descriptive analyses were conducted for the safety evaluation set (SES; all subjects who received study treatment).
Determination of Sample Size
To detect AEs at least once per group with an incidence rate of 3% with a probability of approximately 80%, a sample size of 53 subjects per group was necessary. Assuming an exponential distribution, a median duration of effect of 3 months and a censoring rate of 5%, a minimum of 55 subjects per group, were needed to obtain a precision of 1.1 months with 80% probability and a precision of 1.5 months with 90% probability. In total, approximately 60 subjects per dose group (20U: 30 subjects in both Stage 1 and 2) were deemed necessary.
RESULTS
Participants
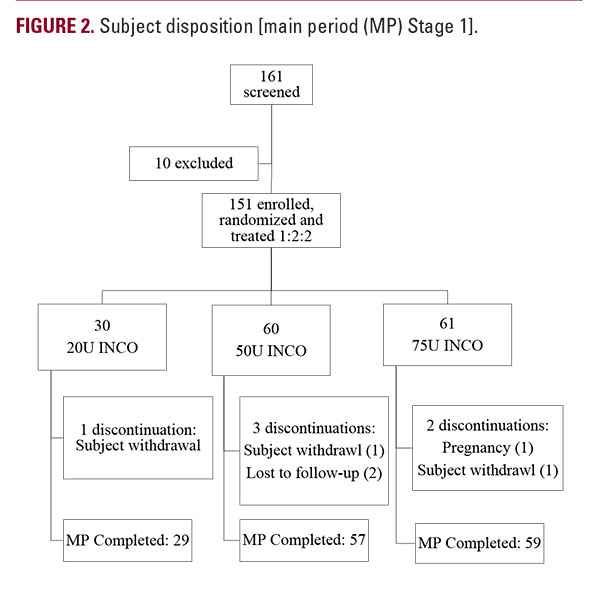
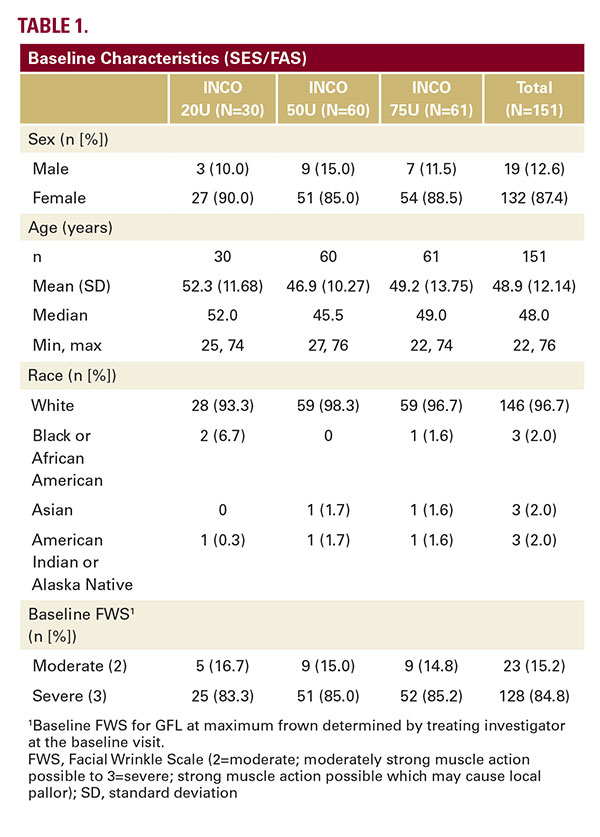
In Stage 1, a total of 161 subjects were screened at 4 sites in Germany and 5 sites in the US, with 151 subjects randomized to receive either 20U (N=30), 50U (N=60) or 75U (N=61) INCO (Figure 2). Six subjects discontinued prior to day 180; all 151 randomized subjects were included in the SES and the FAS according to the intention-to-treat principle. Subject demographics and baseline severity of the GFL were similar for all dose groups. The majority of subjects (N=128, 84.8%) had a baseline score of severe (Table 1).
Primary Efficacy Analysis
The median duration of effect was 185 days for the 50U dose group (95% CI:[182, 205]) and 210 days for the 75U dose group (95% CI:[182, 217]). The Kaplan-Meier plot (Figure 3) reveals a dose effect that was most pronounced between day 120 and day 210. Nearly 100% of subjects had not returned to baseline severity within the first 120 days. From day 210 onward, an increasing number of subjects from all three dose groups returned to baseline. For the 20U dose group, the median duration of effect was 177 days (95% CI: [126, 188] in this first cohort (second 20U cohort to be reported in Stage 2) and nearly 100% of subjects had not returned to baseline severity within the first 90 days. Hazard ratios (HRs) from a Cox proportional hazard regression performed over the entire 360- day follow-up period reached statistical significance for 2 out of 3 pairwise comparisons of dose groups despite the study not being powered for confirmatory statistical significance testing between the groups. HRs indicated significant differences in duration of effect: HR=0.67 (95%-CI: [0.46, 0.98]); P=0.0400) for 75U vs 50U and HR= 0.56 (95%-CI: [0.34, 0.90]; P=0.0166) for 75U vs 20U. A longer duration of effect for 50U vs. 20U was also observed; however, the HR did not reach statistical significance for this comparison (HR=0.83; 95%-CI: [0.51; 1.34]; P=0.4394), likely due to the smaller number of subjects randomized to the 20U group in Stage 1 (30 vs 60 subjects) than to the higher dose groups.